Monitoring at QuizUp: Datadog
One of the services we use a lot for monitoring at QuizUp is Datadog.
We use several software-as-a-service’s, but this one is one of my absolute favorites. Datadog is an aggregator for StatsD metrics, and StatSD is as I have mentioned before, one of my favorite technologies. The way we use Datadog is both through their large set of excellent integrations, which retrieve a host of standard metrics from every third party service in our stack, but also monitor all of our hosts for standard operating system metrics like load average, disk usage, memory usage broken down by application, cpu load, etc; and we’ve written our custom integrations if one did not exist before.
Additionally we instrument our applications with statsd calls which feed important higher level metrics into datadog where all of these can be combined in powerful dashboards and used by metric alerts to trigger e-mails, pings to Slack or PagerDuty, etc. These metric alerts are our first line of defence, allowing us to detect and fix problems before they affect users, so effectively they keep our uptime good. Whether it’s a sudden increase in the number of API non-2xx, increased latencies, disks filling up, elevated service health transitions, cluster size changes, no matter; it’s all fed into Datadog and we’re alerted from there. This is the kind of service, which if it proved flaky, I would get very frustrated very quickly. It’s never been flaky. No pressure ;-)
The purpose of this post is however to point out a fantastic recent feature which I learned about this week, and might just change the way we work when examining incidents. Until now I’ve been heavily utilizing the Screenshot+Dropbox+Copybuffer integration offered by Dropbox, to basically screengrab a portion of a graph or a dashboard, then paste the link to the relevant Slack channel and ping people who I believe should investigate.
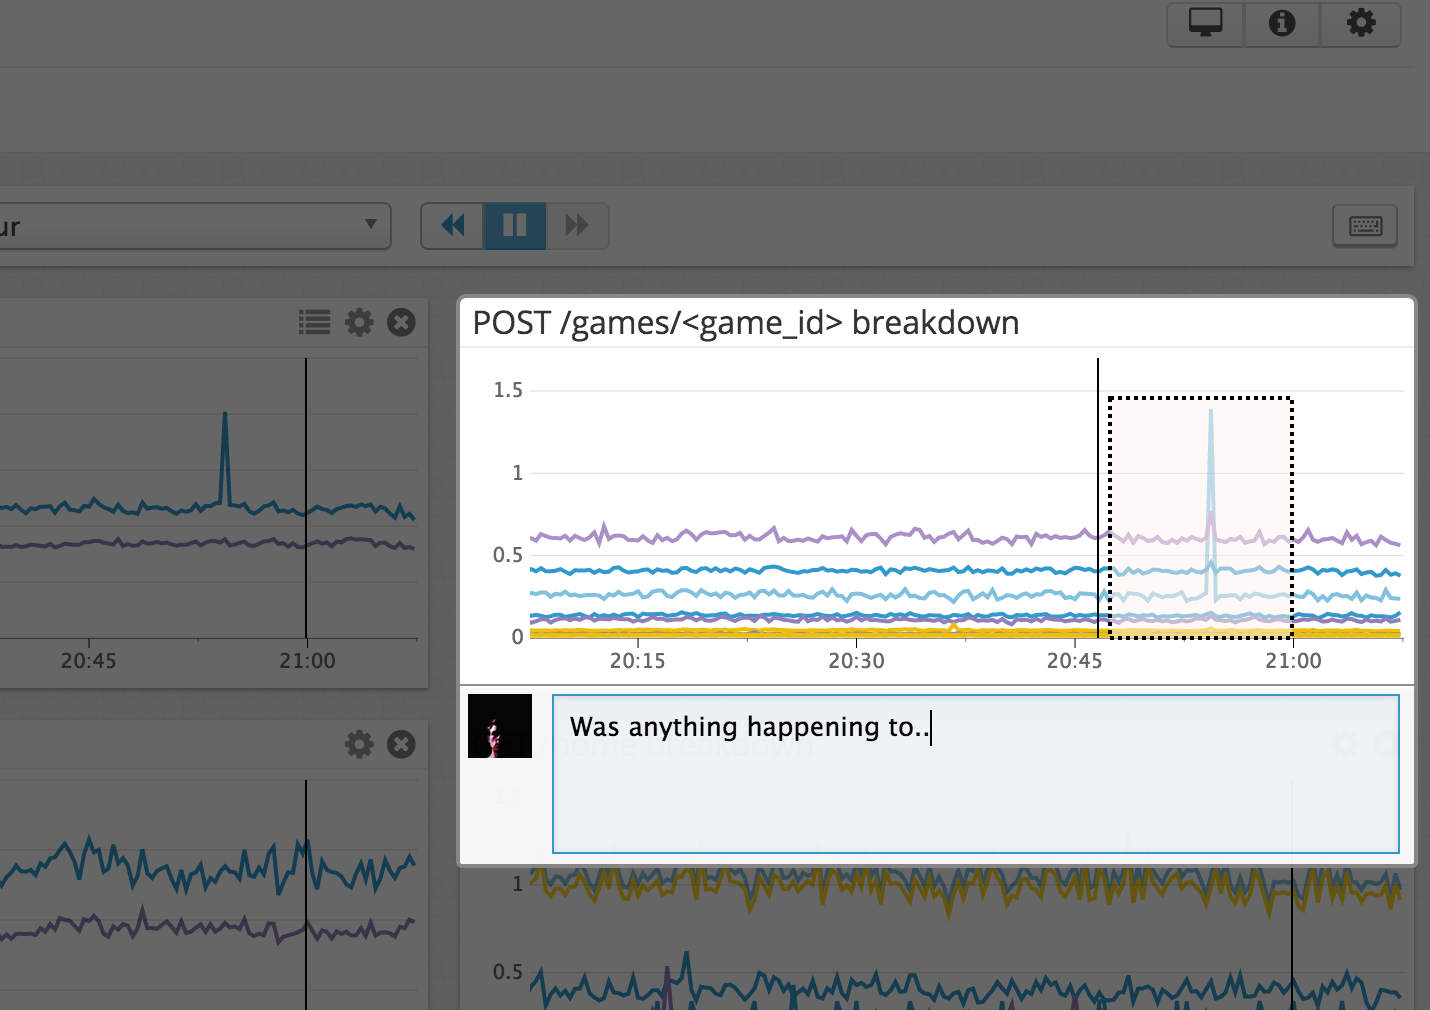
But there’s an easier way to do this, click the snapshot icon and tag the corresponding people, or use a hashtag to add custom tags which can be used with event timeline searches. Also if you have Slack integrated, you can tag the relevant Slack channels directly from the comment. This way the discussion of any issue can happen in context, and the comments and thoughts of the engineers working on the issue will be seen by anyone viewing that particular graph, at that time, later.
Commenting on an anomaly
This week I had the pleasure of meeting Alexis (@alq) from Datadog again, and he showed me this feature amongst others, and also signed me up for notifications when they start beta testing new features.
If you’re running an app and would like to give Datadog a try, but feel the per-host fee is expensive, it’s possible to setup a single datadog statsd collection node and make your other nodes send their metrics to that node. This would not get you their nice host-level monitoring, but it’s a cheap way to try. At QuizUp we monitor all our hosts though, as when running larger instances the fee charged per host is trivial for us, so I highly recommend that if cost is not an issue.